
Results for the year from operations
Group revenue increased by 127.8% to USD 1,147.9m (2010: USD 503.8m) reflecting an increase in activity from the prior year. The increase was largely driven by a higher level of revenue generated from the new build activity, and to a lesser extent an increase in the revenues from upgrade and refurbishment activities and from its service business.
Revenue generated from new build projects increased by 282.3% to USD 789.7m (2010: USD 206.6m). Revenue in 2011 largely reflects the ongoing work on eight new build jackups, three liftboats for the offshore wind farm installation sector and two land rigs. The contract award from PEMSA for the construction of Hull 108 in December 2011 allowed the Group to transfer this asset from inventory to contract work-in-progress, and to recognise revenue and profit in line with the percentage of completion of the project. This revenue and profit had not been previously recognised, despite the high level of completion of the project, as Hull 108 was not contracted to a customer. Revenue from jackup rig upgrade and refurbishment activity increased over the prior year, with a higher level of average expenditure per rig.
Revenue from Land Rig Services, related to the refurbishment and construction of land rigs, reflected an increase over the prior year predominantly resulting from the ongoing work building two 3000HP land drilling rigs for Weatherford. Other revenue increased to USD 114.6m (2010: USD 16.5m) primarily due to the addition of the Group’s new revenue streams including E&C activities and service business.
- Adjusted operating profit USDm
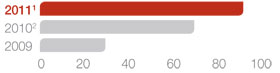
- Adjusted EBITDA USDm
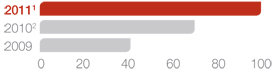
- Adjusted earnings per share US cents
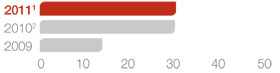
- Adjusted net profit USDm
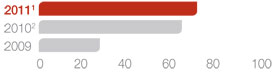
1Adjusted for USD 10.5m of exceptional charges incurred in connection with the acquisition of MIS
2Includes USD 20.4m one-off gain in relation to Riginvest and excludes one-off USD 1.4m loss arising from the closure of Lamprell Asia Limited.
Selected Financial Data
| 2011 (USDm) |
2010 (USDm) |
Change | ||||
|---|---|---|---|---|---|---|
| Revenue | 1,147.9 | 503.8 | 127.8% | |||
| Gross profit | 132.9 | 79.7 | 66.8% | |||
| Gross profit margin | 11.6 | % | 15.8 | % | ||
| Adjusted EBITDA | 100.8 | 78.4 | 28.5% | |||
| Adjusted EBITDA margin | 8.8 | % | 15.6 | % | ||
| Adjusted operating profit | 90.2 | 1 | 69.5 | 2 | 29.8% | |
| Adjusted operating profit margin | 7.9 | % | 13.8 | % | ||
| Adjusted net profit | 73.8 | 1 | 66.6 | 2 | 10.8% | |
| Adjusted net margin | 6.4 | % | 13.2 | % | ||
| Net profit | 63.3 | 65.2 | (2.9% | ) | ||
| Net profit margin | 5.5 | % | 12.9 | % | ||
| Adjusted diluted earnings per share | 30.88 | c | 30.67 | c | 0.7% | |
| Net debt/(cash) | 101.7 | (210.2 | ) |
1Before USD 10.5m of exceptional charges.
2Includes USD 20.4m one-off gain in relation to Riginvest and excludes one-off USD 1.4m loss arising from the closure of Lamprell Asia Limited.
Gross profit increased by 66.8% to USD 132.9m (2010: USD 79.7m) resulting in a gross margin of 11.6% (2010: 15.8%). The decline in gross margin was primarily due to the performance of the Group’s three fixed price windfarm liftboat projects. A provision of USD 14.3m was taken against these projects as previously announced. The gross margin on rig refurbishment was in line with the margin achieved in 2010.
The adjusted operating profit for the year increased by 29.8% to USD 90.2m (2010: USD 69.5m), before exceptional charges of USD 10.5m. Exceptional charges in 2011 reflect certain transaction costs associated with the
acquisition of MIS of USD 10.5m including financial advisory, due diligence and legal fees and a one-off post acquisition charge for the MIS employee share options that were bought out as part of the MIS acquisition. The 2011 adjusted operating profit margin was 7.9% compared to the prior year margin of 13.8%. This decline in year on year adjusted operating profit margin before exceptional charges largely due to the impact of the negative margin arising from the liftboat projects, an additional USD 3.8m of amortisation relating to the MIS intangible assets that were identified and fair valued post acquisition, and the inclusion of a one-off net gain in 2010 related to the cancellation of the contract with Riginvest G.P. amounting to USD 20.4m.
Adjusted EBITDA, before exceptional charges, increased to USD 100.8m (2010: USD 78.4m) a rise of 28.5% over the prior year. The adjusted EBITDA margin before exceptional charges declined from 15.6% to 8.8% in 2011 reflecting the operating performance of the business.
Adjusted net profit, before exceptional charges, increased by 10.8% to USD 73.8m (2010: USD 66.6m) in line with the operating profit and also reflects increased net finance costs in the current year of USD 16.2m (2010: USD 2.9m). These largely arise as a result of increased facility and interest charges related to the MIS acquisition facilities and increased facility and guarantee charges related to new contract awards in the year. The adjusted net profit margin, before exceptional charges, of 6.4% (2010: 13.2%) reflects the increased net finance costs and the operational performance of the business.
Net profit for the year attributable to equity shareholders was USD 63.3m (2010: USD 65.2m), a decrease of 2.9%.
Interest income
Interest income of USD 1.8m (2010: USD 2.2m) relates mainly to bank interest earned on surplus funds, margin deposits and fixed deposits maintained against guarantees. The decrease reflects a lower level of average cash balances during the year when compared to 2010.
Taxation
The tax charge of USD 0.2m arising in 2011 is in respect of tax on the Group’s service operations in Kazakhstan and Qatar. The Group is not currently subject to income tax in respect of its operations carried out in the United Arab Emirates, and does not anticipate any liability to income tax arising on these operations in the foreseeable future. The Company, which is incorporated in the Isle of Man, has no income tax liability for the year ended 31 December 2011 as it is taxable at 0% in line with local Isle of Man tax legislation.
Earnings per share
Fully diluted adjusted earnings per share, before exceptional charges, amounts to 30.88 cents for 2011 (2010: 30.67 cents) reflecting the operational performance of the Group for the year. The comparative figures for earnings per ordinary share have been restated for the bonus element of the June 2011 rights issue in line with IAS 33.
Operating cash flow and liquidity
The Group’s net cash flow from operating activities for the year reflected a net outflow of USD 54.7m (2010: USD 232.8m net inflow). Prior to working capital movements the Group’s net cash inflow was USD 105.2m (2010: USD 65.9m).The negative working capital movement was largely driven by an

increase in trade and other receivables, and was offset to a lesser extent by a decrease in trade and other payables and a reduction in inventory as a result of the contract award for Hull 108. The significant increase in trade and other receivables largely arose from increased amounts due from customers at 31 December 2011 amounting to USD 386.2m (2010: USD 58.0m). This reflects the increase in the number of ongoing EPC projects at the year end and, in particular, two new build projects where the majority of the payment will be received upon delivery in 2012.
Net cash used in investing activities totaled USD 408.8m (2010: USD 99.4m), primarily comprising the MIS purchase consideration (net of cash acquired) of USD 322.2m (2010: Nil), USD 55.5m (2010: USD 29.7m) of fixed asset additions, and USD 32.1m (2010: USD 63.8m) of margin deposits and deposits greater than three months. The fixed asset additions were mainly in relation to the ongoing development at the Hamriyah facility that was formally opened in October 2011, and the purchase of operating equipment.
Net cash generated from financing activities reflected an amount of USD 371.1m (2010: USD 46.3m used in financing activities). This largely arose from net proceeds from the issue of share capital of USD 216.6m (2010: Nil) and an increase in borrowings of USD 199.4m (2010: USD 22.5m decrease) both used to finance the MIS acquisition, increased finance costs of USD 18.0m (2010: USD 5.1m) largely arising as a result of facility and guarantee charges related to new contract awards in the year and dividend payments of USD 29.3m (2010: USD 15.2m).
Capital expenditure
Capital expenditure on property, plant and equipment during the year amounted to USD 55.5m (2010: USD 29.7m). The main area of expenditure was the investment in buildings and related infrastructure at Group facilities amounting to USD 26.0m (2010: USD 20.2m), including capital work-in-progress, with additional committed expenditure amounting to USD 18.7m, reflecting the development of the infrastructure of the Group at all facilities but primarily expenditure at the new Hamriyah facility. Further expenditure on operating equipment amounted to USD 9.9m (2010: USD 8.6m) to support the growth in activities experienced during the year and to replace hired equipment, where this was deemed cost effective, and to upgrade a semi-submersible barge acquired during the year.
Balance sheet
Total non-current assets increased to USD 417.1m (2010: USD 125.1m), driven by a USD 62.1m increase in property, plant and equipment and a USD 228.4m increase in identified intangible assets. The increase in intangible assets arose primarily on the MIS acquisition, of which goodwill accounts for USD 180.5m and intangible assets represent USD 50.0m. Trade and other receivables increased to USD 668.8m (2010: USD 251.1m), this reflects the increase in the number of ongoing new build projects at the year end and, in particular, the two new build projects, Zaratan and Hull 108, where the majority of the payment will be received upon delivery in 2012.
The year end net debt was USD 101.7m (2010: net cash USD 210.2m) arising as a result of the borrowings required to finance the MIS acquisition and the additional utilisation of facilities to fund the increased number of new build projects. Upon delivery of Zaratan and Hull 108, expected during 2012, the Group is required to use a proportion of the final payments to retire some of the MIS acquisition facilities.
Shareholders’ equity increased from USD 284.0m at 31 December 2010 to USD 533.9m at 31 December 2011. The movement arises as a result of total comprehensive income for the year of USD 61.4m (2010: USD 65.8m) and total transactions with shareholders of USD 188.5m (2010: decrease of USD 16.6m), which mainly includes proceeds from shares issued of USD 216.6m, partly offset by dividend payments of USD 29.3m.
Dividends
For the year ended 31 December 2011, the Board of Directors of the Group having duly considered the current market conditions, profit earned, cash generated during the year and taking note of the capital commitments for the year 2012, recommends a final dividend of 8.00 cents per share. If approved this will be paid to shareholders on 22 June 2012 provided they were on the register on 25 May 2012.
Jonathan Cooper
Chief Financial Officer